

Trace View Experimental 5.0.0+
browser.traceView records browser interactions as DOM snapshots and lets you replay them step by step in Vitest's built-in trace viewer. It is useful when the live browser view is not enough: you can inspect earlier tests, failed retries, screenshots, assertions, and user actions after the browser has already moved on.
Trace view is additive to the current browser testing workflow. Enabling it does not force a single debugging mode. You can use it with the normal local browser UI, with a headless browser and Vitest UI, or with the HTML reporter in CI.
Trace view, browser UI, and HTML reports
The normal local browser mode opens the browser UI, where tests run in a visible iframe. This is useful while developing, but the iframe only shows the current browser state. When another test runs, the previous rendered state is gone.
browser.traceView keeps a replayable record for each test. In local browser UI mode, the trace viewer appears alongside the existing live view so you can keep using the browser UI while also inspecting recorded steps.
For static output, add the HTML reporter. The same trace viewer can then be opened from the generated report, which is useful for run-mode and CI failures.
Looking for Playwright traces?
This page now documents Vitest's built-in browser.traceView feature. The previous browser.trace guide for Playwright traces moved to Playwright Traces.
Quick Start
Enable trace view with the browser.traceView option:
import { defineConfig } from 'vitest/config'

export default defineConfig({
  test: {
    browser: {
      traceView: true,
    },
  },
})vitest --browser.traceViewWhen browser.traceView is enabled, tests with recorded traces can be opened in the trace viewer from the browser UI, Vitest UI, and HTML reporter. The viewer has two resizable panes:
- Step list (left) — every recorded action, assertion, mark, and lifecycle entry, with name, timing, selector, and source location. Failed actions and assertions are highlighted in red.
- DOM snapshot (right) — a reconstruction of the page at the selected step. The interacted element is highlighted in blue.
Selecting a step also opens its source location in the Editor tab when that location is available.
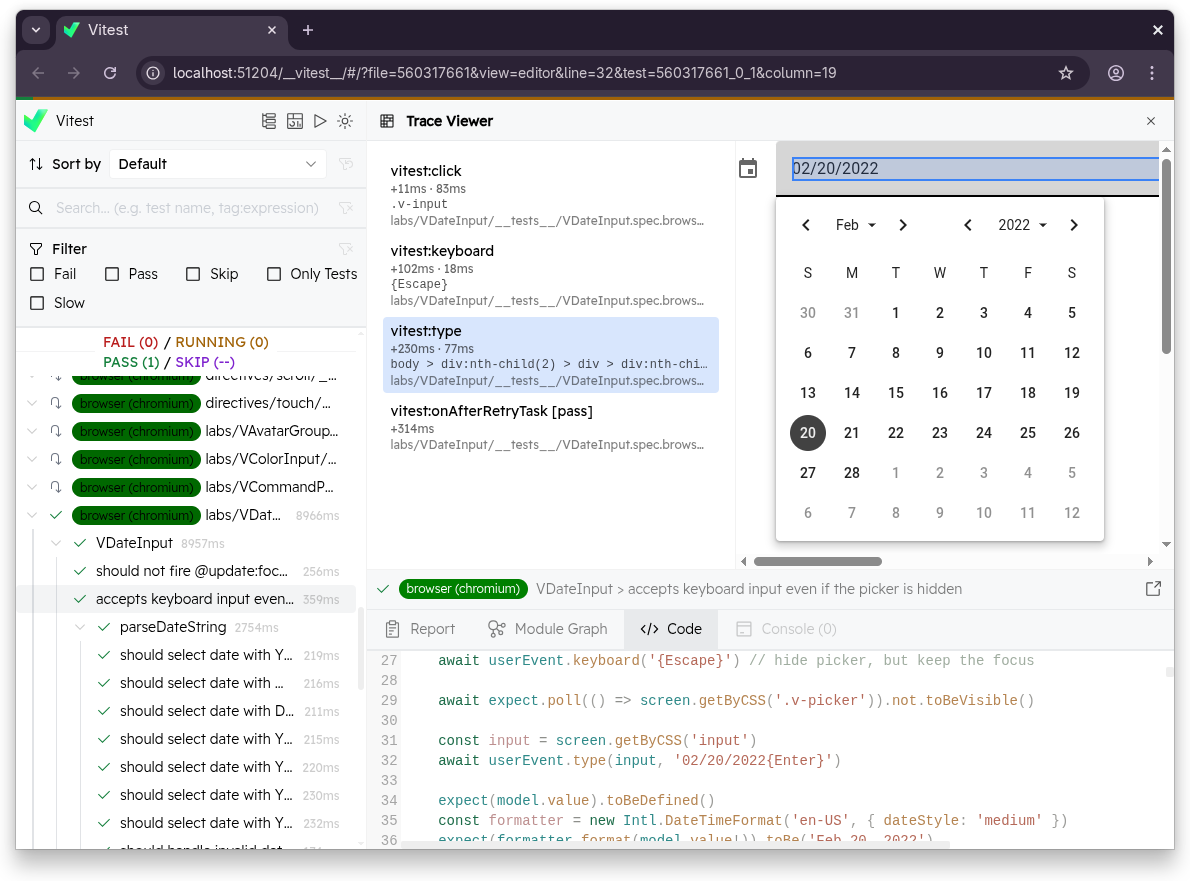
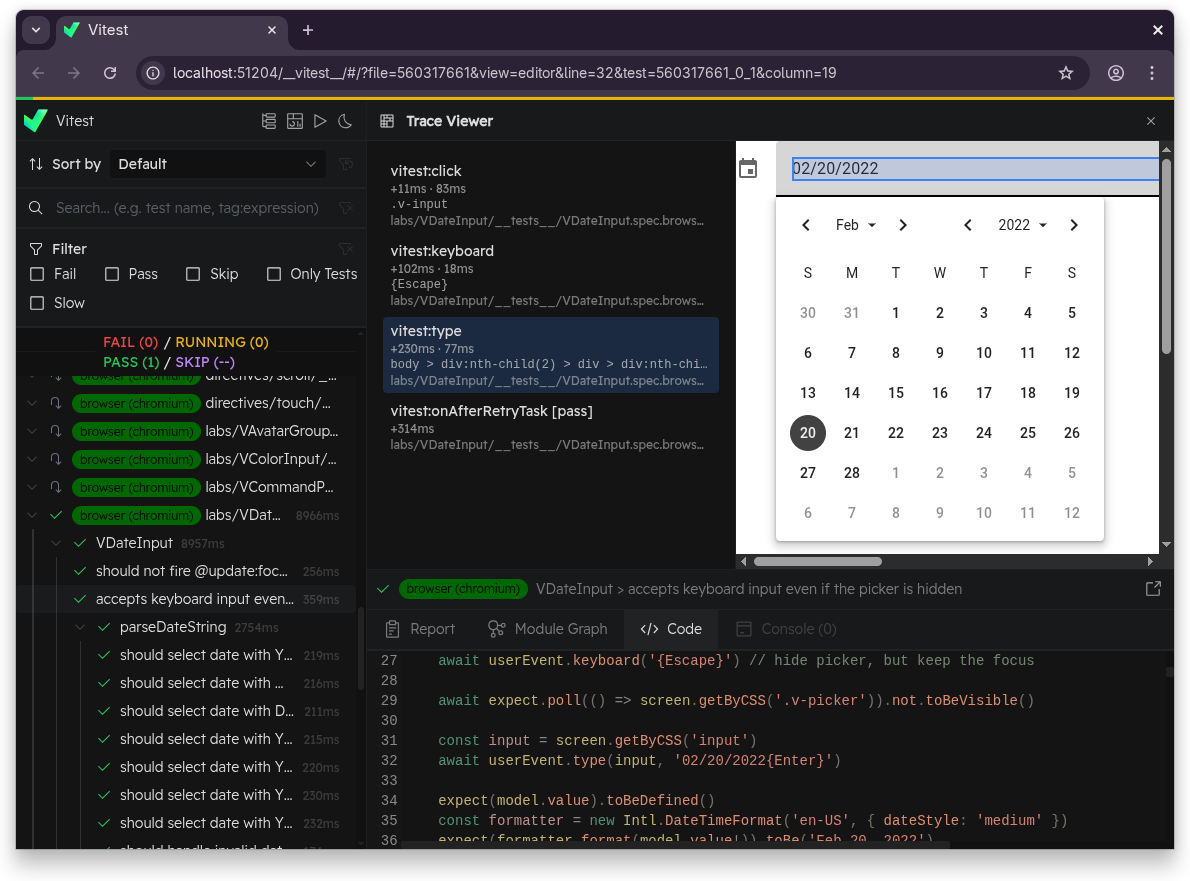
Example replay uses Vuetify's VDateInput component.
Common Setups
browser.traceView records traces. The browser mode, UI, and reporter options determine where you inspect them.
| Goal | Configuration | Result |
|---|---|---|
| Add trace replay to the normal local browser UI | vitest --browser.traceView | Uses the default local headed browser UI and adds trace replay for recorded tests. |
| Debug locally with a headless browser | vitest --browser.traceView --browser.headless --ui | The browser runs headless, while Vitest UI shows recorded trace steps and snapshots. |
| Debug locally with a visible browser window and Vitest UI | vitest --browser.traceView --browser.headless=false --browser.ui=false --ui | Vitest UI shows recorded trace steps and snapshots, while tests run in a separate headed browser window. |
| Generate a static report for CI or run mode | vitest run --browser.traceView --reporter=html | The HTML report includes the trace viewer for recorded tests. |
Relation to Playwright Traces
browser.traceView and browser.trace are independent features:
browser.traceView | browser.trace | |
|---|---|---|
| Provider support | All providers (playwright, webdriverio, preview) | Playwright only |
| Viewer | Browser UI / Vitest UI / HTML reporter | Playwright Trace Viewer / trace.playwright.dev |
| Format | rrweb DOM snapshots | Playwright .trace.zip |
| Requires external tool | No | Yes (npx playwright show-trace) |
You can enable both at the same time. See Playwright Traces for the browser.trace workflow.
Recorded Steps
Trace entries are recorded automatically for:
expect.element(...)assertions- Interactive actions like
click,dblClick,tripleClick,fill,clear,type,hover,selectOptions,upload,dragAndDrop,tab,keyboard,wheel, and screenshots - Test runner lifecycle event (e.g.
vitest:onAfterRetryTaskis recorded after each test and retry run)
Each entry captures the DOM state at that point, along with timing information, the selector, and the source location that triggered it.
In Vitest UI, trace entries are streamed as the test runs, so you can inspect recorded steps before the test finishes. Long-running actions, expect.element(...) assertions, and callback page.mark() entries appear as in-progress steps first, then update with their final status and duration.
Custom Trace Entries
You can insert your own named entries with page.mark() and locator.mark():
import { page } from 'vitest/browser'

await page.mark('content rendered')

await page.getByRole('button', { name: 'Sign in' }).mark('sign in button')
You can also pass a callback to page.mark(). Note that grouping is not currently supported — each inner action is recorded individually, and the mark entry appears at the end:
await page.mark('sign in flow', async () => {
  await page.getByRole('textbox', { name: 'Email' }).fill('john@example.com')
  await page.getByRole('textbox', { name: 'Password' }).fill('secret')
  await page.getByRole('button', { name: 'Sign in' }).click()
})
Use vi.defineHelper() to make entries from reusable helpers point to the call site rather than the helper's internals:
import { vi } from 'vitest'
import { page } from 'vitest/browser'

const renderContent = vi.defineHelper(async (html: string) => {
  document.body.innerHTML = html
  await page.elementLocator(document.body).mark('render')
})

test('shows button', async () => {
  await renderContent('<button>Hello</button>') // trace entry points here
})
Retries and Repeats
Each attempt — retry or repeat — is recorded as a separate trace. When a test has multiple attempts, the viewer opens the most recent one by default. You can switch between attempts in the Report tab.
Snapshot Fidelity
By default, trace view captures the DOM tree, attributes, form values, same-origin readable CSS, element scroll positions, viewport size, and window scroll position. Images and canvas pixels are not inlined by default.
Stylesheets are captured through the browser's CSSOM. Readable <style> tags and same-origin <link rel="stylesheet"> files are serialized into the snapshot and replayed as inline styles, so normal component styles keep working in the trace viewer and HTML reporter. This captures the parsed CSS rules the browser applied, not the exact original stylesheet bytes: comments, formatting, invalid rules, and CSS resource files such as background images or fonts are not bundled this way.
Enable additional fidelity options with the object form:
import { defineConfig } from 'vitest/config'

export default defineConfig({
  test: {
    browser: {
      traceView: {
        enabled: true,
        inlineImages: true,
        recordCanvas: true,
      },
    },
  },
})
inlineImages stores loaded <img> pixels in the trace snapshot. This is mostly useful for the HTML reporter, where the report should be portable without depending on external image URLs. This is pixel capture, not original resource capture: SVGs are rasterized, animated images are not preserved as animations, and CSS background images or fonts are not covered. Cross-origin images need CORS-readable pixels to be inlined; otherwise they can still render from the external URL if it remains reachable.
recordCanvas stores readable canvas pixels in the trace snapshot. This is useful for charts and simple 2D canvas output, but it is not a full canvas drawing timeline and does not provide complete WebGL replay.
External Resource Limits
Trace view does not currently provide a general resource store. Resources that are not captured into the snapshot remain URL-backed.
This means CSS background images and @font-face files referenced from serialized CSS still depend on their original URLs. External images can still render in the viewer when the browser can load the URL, but they are not portable in the HTML reporter unless inlineImages can capture their pixels. Cross-origin images need CORS-readable pixels for that capture; otherwise the browser can display them, but rrweb cannot safely draw them into a canvas data URL.
Use inlineImages for loaded <img> elements that need to be portable in the HTML reporter. CSS subresources, fonts, non-CORS cross-origin images, videos, and other external files remain limitations of the current snapshot-based trace format.
Canvas replay sandbox
recordCanvas enables a weaker iframe sandbox in the trace viewer. rrweb replays canvas data through an image load handler, so Vitest allows scripts inside the replay iframe for traces recorded with recordCanvas. Keep this option enabled only when canvas pixels are useful for debugging.