

Open Telemetry Support experimental
FEEDBACK
Please, leave feedback regarding this feature in a GitHub Discussion.
Example Project
OpenTelemetry traces can be a useful tool to debug the performance and behavior of your application inside tests.
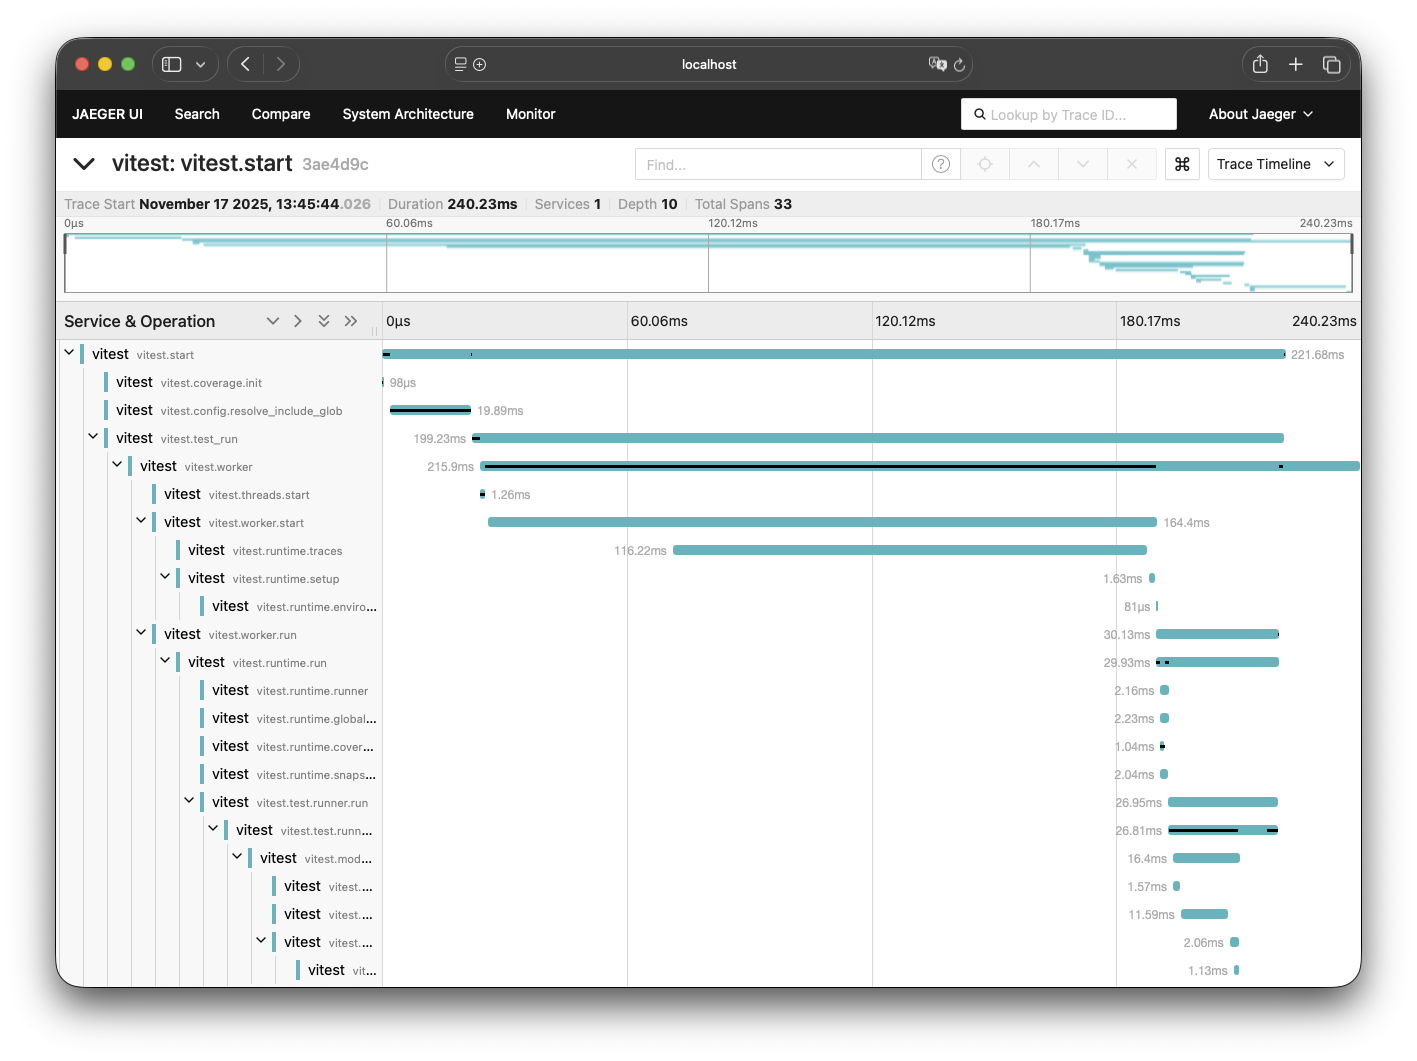
If enabled, Vitest integration generates spans that are scoped to your test's worker.
WARNING
OpenTelemetry initialization increases the startup time of every test unless Vitest runs without isolation. You can see it as the vitest.runtime.traces span inside vitest.worker.start.
To start using OpenTelemetry in Vitest, specify an SDK module path via experimental.openTelemetry.sdkPath and set experimental.openTelemetry.enabled to true. Vitest will automatically instrument the whole process and each individual test worker.
Make sure to export the SDK as a default export, so that Vitest can flush the network requests before the process is closed. Note that Vitest doesn't automatically call start.
Quickstart
Before previewing your application traces, install required packages and specify the path to your instrumentation file in the config.
npm i @opentelemetry/sdk-node @opentelemetry/auto-instrumentations-node @opentelemetry/exporter-trace-otlp-protoimport { getNodeAutoInstrumentations } from '@opentelemetry/auto-instrumentations-node'
import { OTLPTraceExporter } from '@opentelemetry/exporter-trace-otlp-proto'
import { NodeSDK } from '@opentelemetry/sdk-node'
const sdk = new NodeSDK({
serviceName: 'vitest',
traceExporter: new OTLPTraceExporter(),
instrumentations: [getNodeAutoInstrumentations()],
})
sdk.start()
export default sdkimport { defineConfig } from 'vitest/config'
export default defineConfig({
test: {
experimental: {
openTelemetry: {
enabled: true,
sdkPath: './otel.js',
},
},
},
})FAKE TIMERS
If you are using fake timers, it is important to reset them before the test ends, otherwise traces might not be tracked properly.
Vitest doesn't process the sdkPath module, so it is important that the SDK can be imported within your Node.js environment. It is ideal to use the .js extension for this file. Using another extension will slow down your tests and may require providing additional Node.js arguments.
If you want to provide a TypeScript file, make sure to familiarize yourself with TypeScript page in the Node.js documentation.
Custom Traces
You can use the OpenTelemetry API yourself to track certain operations in your code. Custom traces automatically inherit the Vitest OpenTelemetry context:
import { trace } from '@opentelemetry/api'
import { test } from 'vitest'
import { db } from './src/db'

const tracer = trace.getTracer('vitest')

test('db connects properly', async () => {
  // this is shown inside `vitest.test.runner.test.callback` span
  await tracer.startActiveSpan('db.connect', () => db.connect())
})
Browser Mode
When running tests in browser mode, Vitest propagates trace context between Node.js and the browser. Node.js side traces (test orchestration, browser driver communication) are available without additional configuration.
To capture traces from the browser runtime, provide a browser-compatible SDK via browserSdkPath:
npm i @opentelemetry/sdk-trace-web @opentelemetry/exporter-trace-otlp-protoimport {
BatchSpanProcessor,
WebTracerProvider,
} from '@opentelemetry/sdk-trace-web'
import { OTLPTraceExporter } from '@opentelemetry/exporter-trace-otlp-proto'
const provider = new WebTracerProvider({
spanProcessors: [
new BatchSpanProcessor(new OTLPTraceExporter()),
],
})
provider.register()
export default providerimport { defineConfig } from 'vitest/config'
export default defineConfig({
test: {
browser: {
enabled: true,
provider: 'playwright',
instances: [{ browser: 'chromium' }],
},
experimental: {
openTelemetry: {
enabled: true,
sdkPath: './otel.js',
browserSdkPath: './otel-browser.js',
},
},
},
})ASYNC CONTEXT
Unlike Node.js, browsers do not have automatic async context propagation. Vitest handles this internally for test execution, but custom spans in deeply nested async code may not propagate context automatically.
View Traces
To generate traces, run Vitest as usual. You can run Vitest in either watch mode or run mode. Vitest will call sdk.shutdown() manually after everything is finished to make sure traces are handled properly.
You can view traces using any of the open source or commercial products that support OpenTelemetry API. If you did not use OpenTelemetry before, we recommend starting with Jaeger because it is really easy to setup.
@opentelemetry/api
Vitest declares @opentelemetry/api as an optional peer dependency, which it uses internally to generate spans. When trace collection is not enabled, Vitest will not attempt to use this dependency.
When configuring Vitest to use OpenTelemetry, you will typically install @opentelemetry/sdk-node, which includes @opentelemetry/api as a transitive dependency, thereby satisfying Vitest's peer dependency requirement. If you encounter an error indicating that @opentelemetry/api cannot be found, this typically means trace collection has not been enabled. If the error persists after proper configuration, you may need to install @opentelemetry/api explicitly.
Inter-Process Context Propagation
Vitest supports automatic context propagation from parent processes via the TRACEPARENT and TRACESTATE environment variables as defined in the OpenTelemetry specification. This is particularly useful when running Vitest as part of a larger distributed tracing system (e.g., CI/CD pipelines with OpenTelemetry instrumentation).