

Profiling Test Performance
When you run Vitest it reports multiple time metrics of your tests:
bashRUN v2.1.1 /x/vitest/examples/profiling ✓ test/prime-number.test.ts (1) 4517ms ✓ generate prime number 4517ms Test Files 1 passed (1) Tests 1 passed (1) Start at 09:32:53 Duration 4.80s (transform 44ms, setup 0ms, import 35ms, tests 4.52s, environment 0ms) # Time metrics ^^
- Transform: How much time was spent transforming the files. See File Transform.
- Setup: Time spent for running the
setupFilesfiles. - Import: Time it took to import your test files and their dependencies. This also includes the time spent collecting all tests. Note that this doesn't include dynamic imports inside of tests.
- Tests: Time spent for actually running the test cases.
- Environment: Time spent for setting up the test
environment, for example JSDOM.
Test Runner
In cases where your test execution time is high, you can generate a profile of the test runner. See NodeJS documentation for following options:
WARNING
The --prof option does not work with pool: 'threads' due to node:worker_threads limitations.
To pass these options to Vitest's test runner, define execArgv in your Vitest configuration:
import { defineConfig } from 'vitest/config'

export default defineConfig({
  test: {
    fileParallelism: false,
    execArgv: [
      '--cpu-prof',
      '--cpu-prof-dir=test-runner-profile',
      '--heap-prof',
      '--heap-prof-dir=test-runner-profile'
    ],
  },
})
After the tests have run there should be a test-runner-profile/*.cpuprofile and test-runner-profile/*.heapprofile files generated. See Inspecting profiling records for instructions how to analyze these files.
See Profiling | Examples for example.
Main Thread
Profiling main thread is useful for debugging Vitest's Vite usage and globalSetup files. This is also where your Vite plugins are running.
TIP
See Performance | Vite for more tips about Vite specific profiling.
We recommend vite-plugin-inspect for profiling your Vite plugin performance.
To do this you'll need to pass arguments to the Node process that runs Vitest.
$ node --cpu-prof --cpu-prof-dir=main-profile ./node_modules/vitest/vitest.mjs --run
#      ^^^^^^^^^^^^^^^^^^^^^^^^^^^^^^^^^^^^^^                                  ^^^^^
#               NodeJS arguments                                           Vitest arguments
After the tests have run there should be a main-profile/*.cpuprofile file generated. See Inspecting profiling records for instructions how to analyze these files.
File Transform
This profiling strategy is a good way to identify unnecessary transforms caused by barrel files. If these logs contain files that should not be loaded when your test is run, you might have barrel files that are importing files unnecessarily.
You can also use Vitest UI to debug slowness caused by barrel file. The example below shows how importing files without barrel file reduces amount of transformed files by ~85%.
├── src
│   └── utils
│       ├── currency.ts
│       ├── formatters.ts  <-- File to test
│       ├── index.ts
│       ├── location.ts
│       ├── math.ts
│       ├── time.ts
│       └── users.ts
├── test
│   └── formatters.test.ts
└── vitest.config.tsimport { expect, test } from 'vitest'
import { formatter } from '../src/utils'
import { formatter } from '../src/utils/formatters'
test('formatter works', () => {
expect(formatter).not.toThrow()
})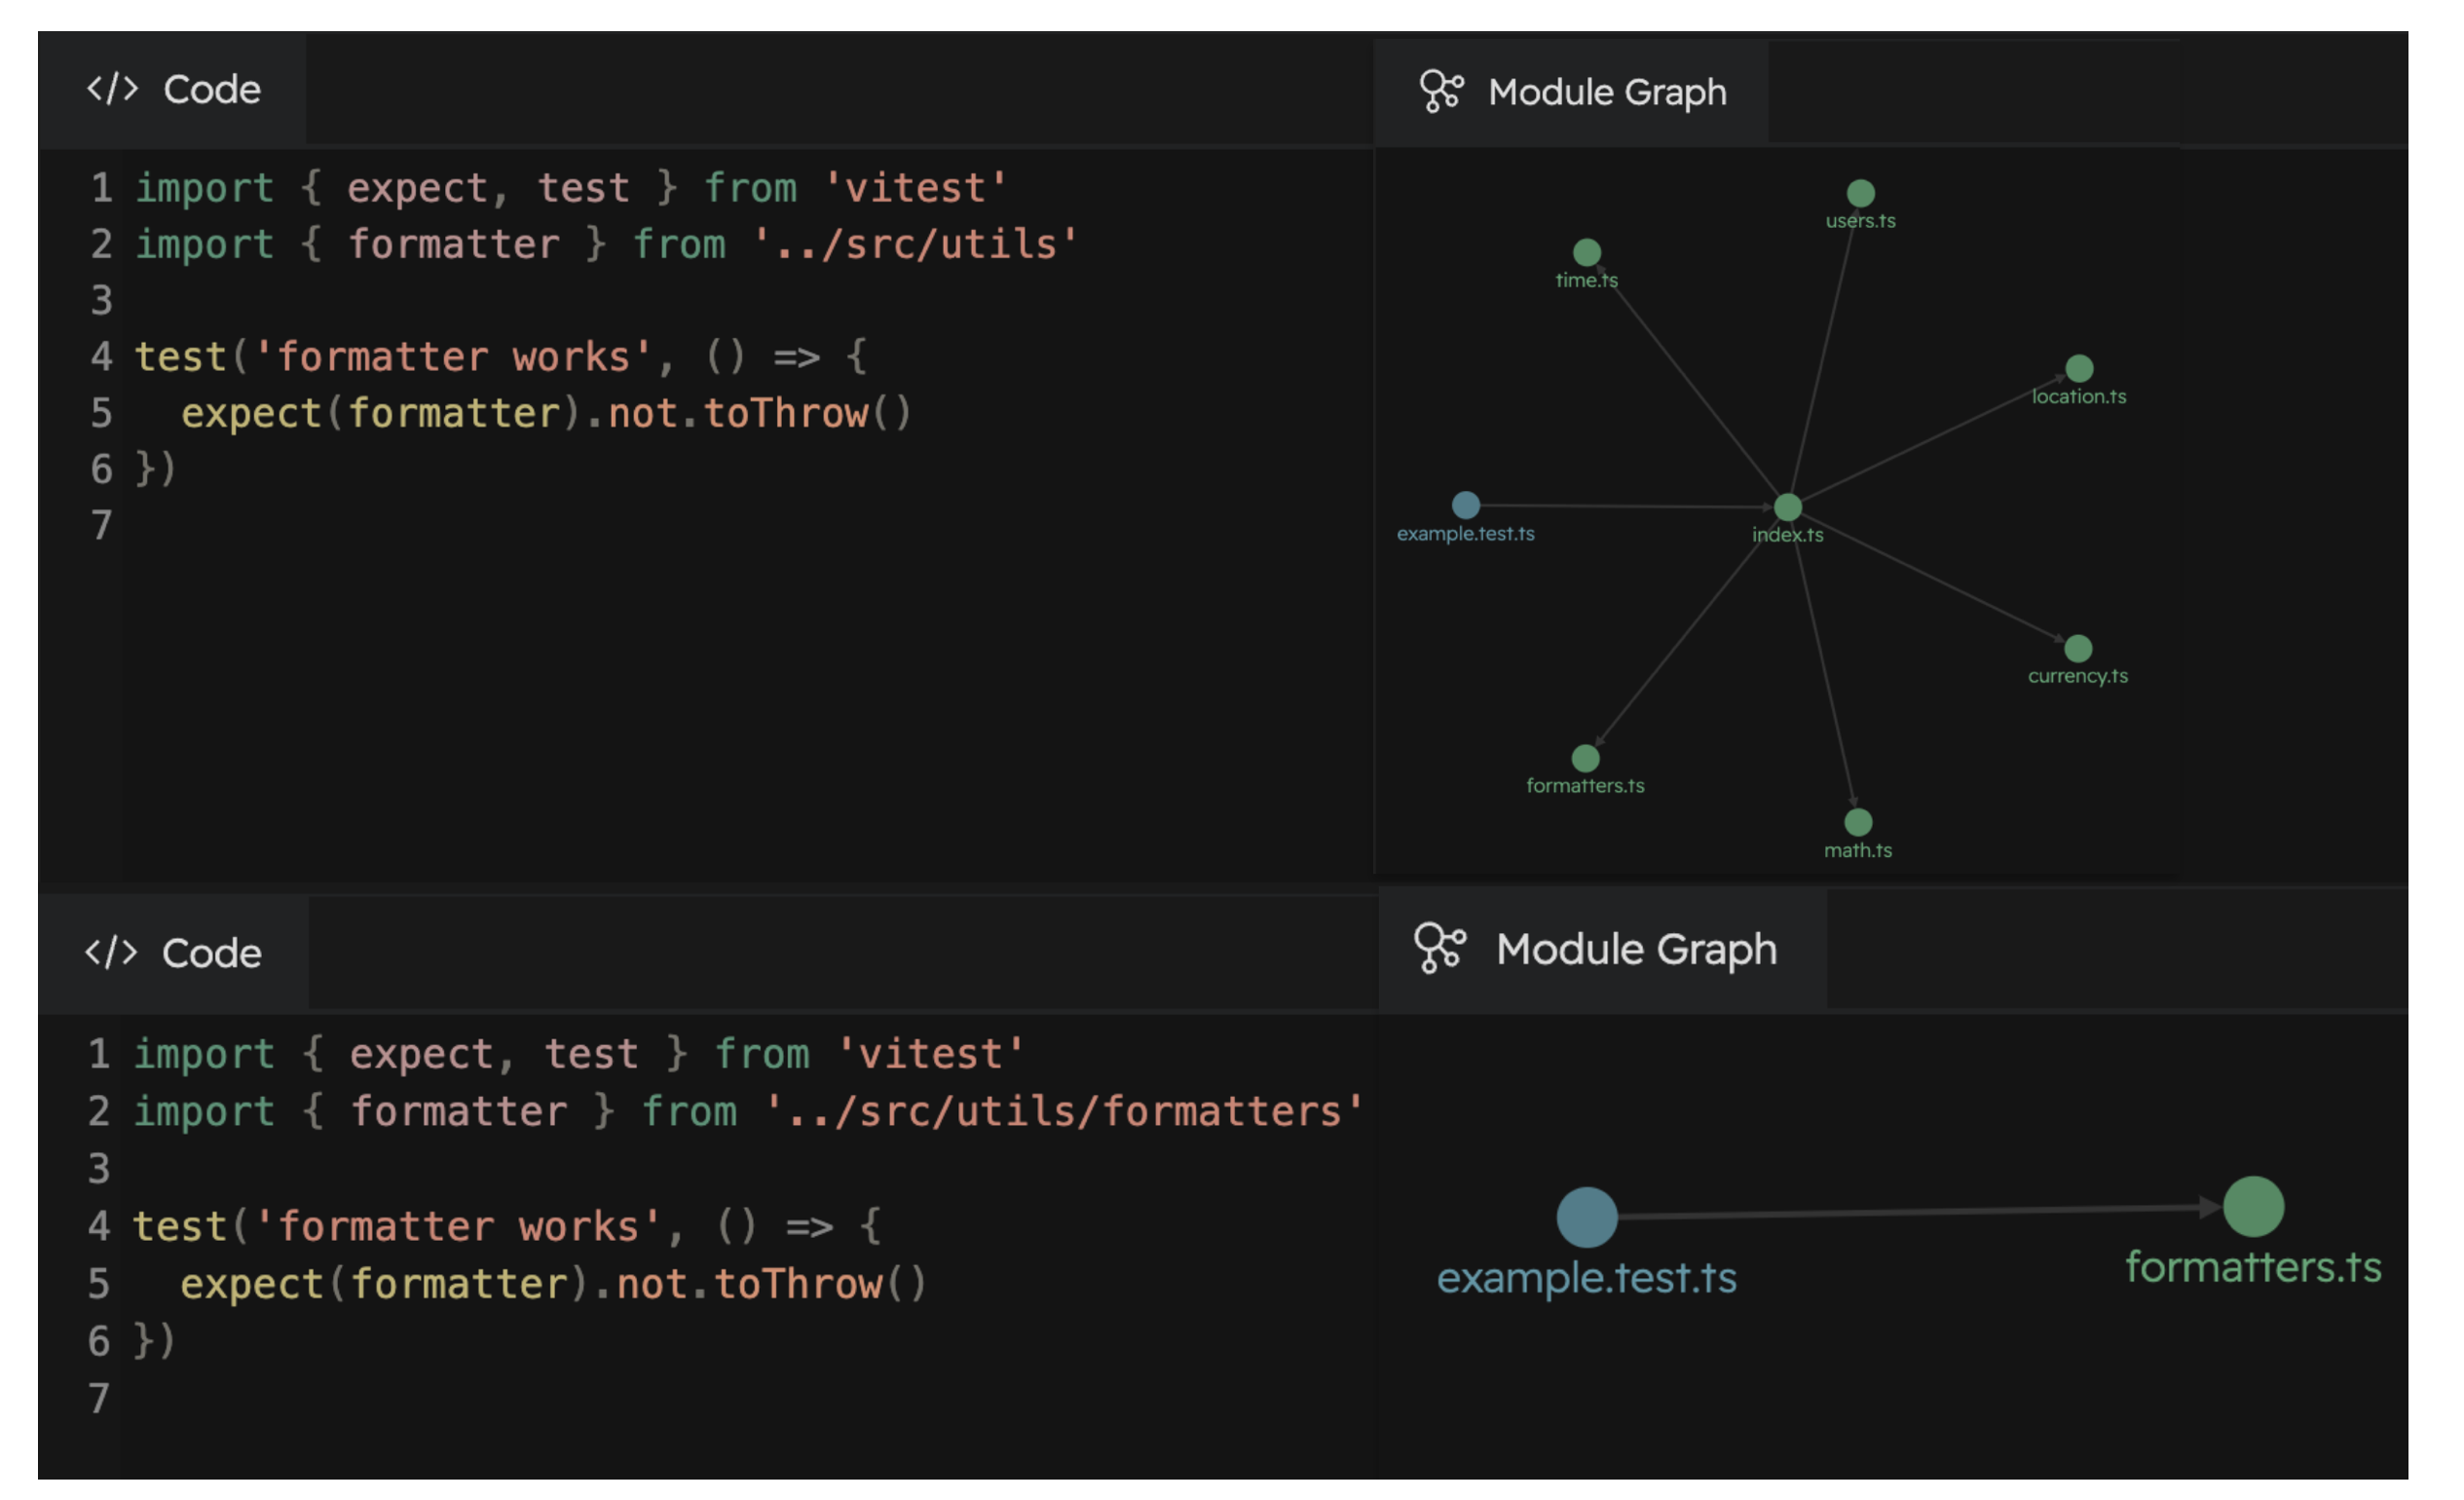
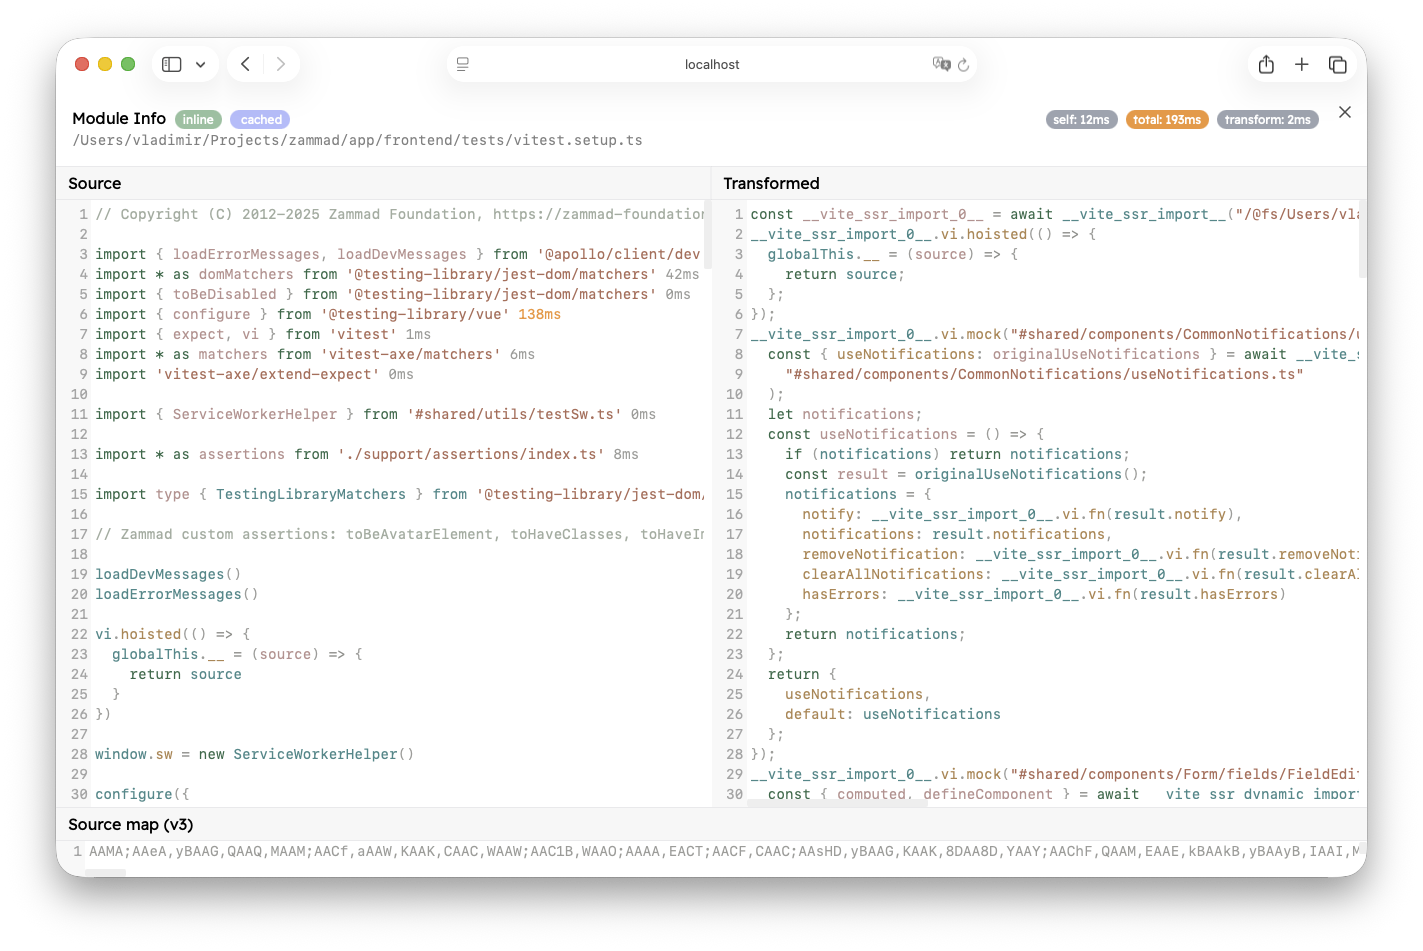
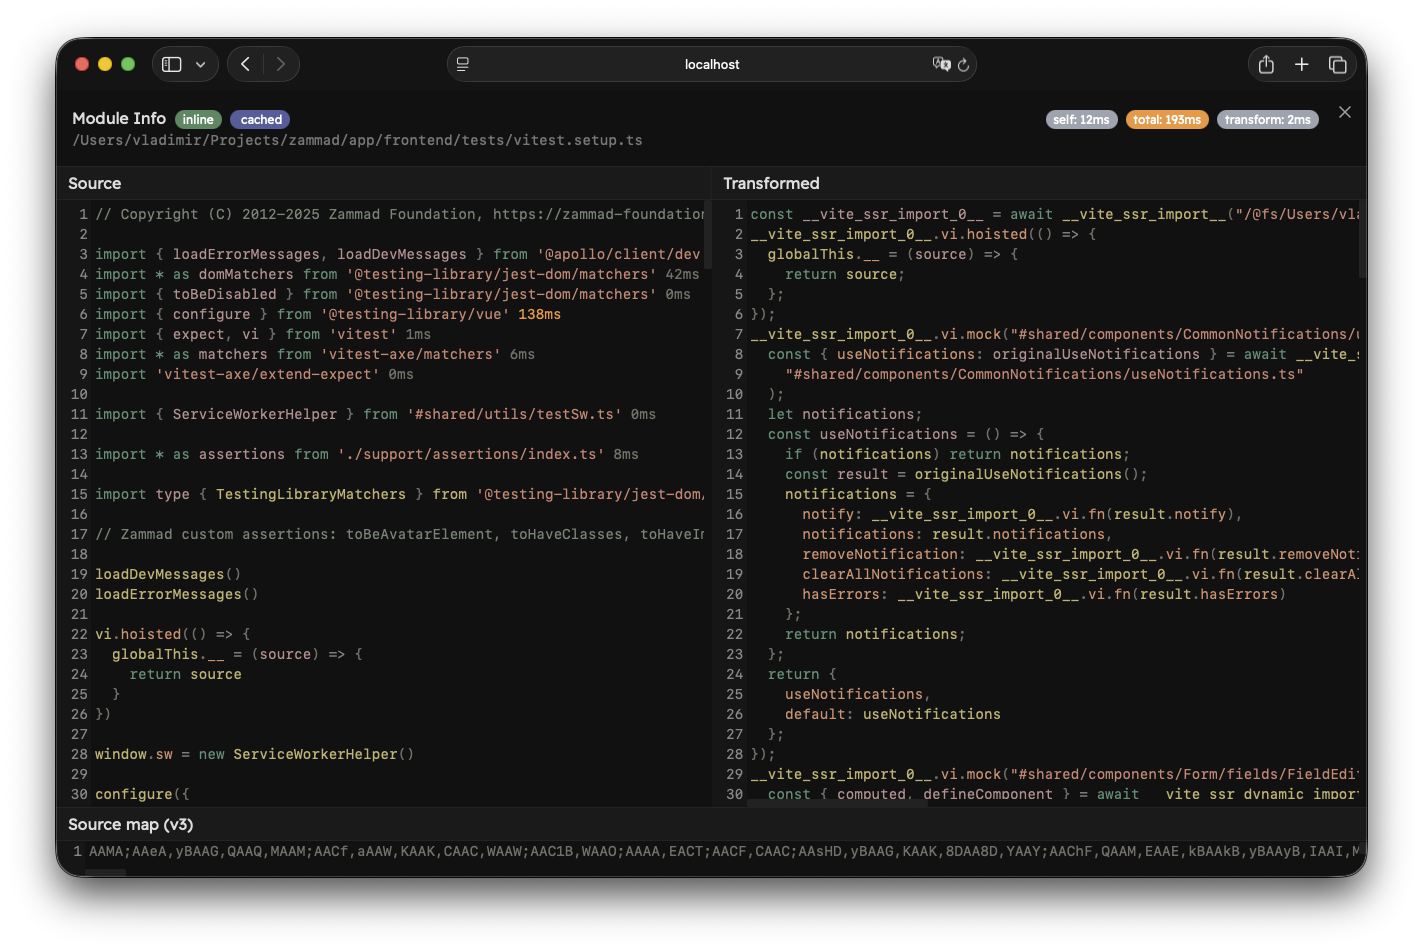
To see how files are transformed, you can open the "Module Info" view in the UI:
File Import
Some modules just take a long time to load. To identify which modules are the slowest, enable experimental.importDurations in your configuration:
import { defineConfig } from 'vitest/config'

export default defineConfig({
  test: {
    experimental: {
      importDurations: {
        print: true,
      },
    },
  },
})
This will print a breakdown of the slowest imports after your tests finish:
Import Duration Breakdown (Top 10)

Module                      Self     Total
my-test.test.ts              5ms    620ms [████████████████████]
date-fns/index.js          500ms    500ms [████████████████░░░░]
src/utils/helpers.ts        10ms    120ms [████████░░░░░░░░░░░░]
You can also use --experimental.importDurations.print from the CLI without changing your configuration:
vitest --experimental.importDurations.printOnce you've identified the slow modules, there are several strategies to speed up imports:
Use Specific Entry Points
Many libraries ship multiple entry points. Importing the main entry point (which is often a barrel file) can pull in far more code than you need.
For example, date-fns re-exports hundreds of functions from its main entry point. Instead of importing from the top-level module, import directly from the specific function:
import { format } from 'date-fns'
import { format } from 'date-fns/format'
Use resolve.alias to Redirect Imports
If a dependency doesn't provide granular entry points, or if third-party code imports the heavy entry point, you can use resolve.alias to redirect imports to a lighter alternative:
import { defineConfig } from 'vitest/config'

export default defineConfig({
  resolve: {
    alias: [
      {
        find: /^date-fns$/,
        replacement: join(dirname(require.resolve('date-fns/package.json')), 'index.cjs'),
      },
    ]
  },
})
Use the Dependency Optimizer
Vitest can bundle external libraries into a single file using deps.optimizer, which reduces the overhead of importing packages with many internal modules:
import { defineConfig } from 'vitest/config'

export default defineConfig({
  test: {
    deps: {
      optimizer: {
        ssr: {
          enabled: true,
          include: ['date-fns'],
        },
      },
    },
  },
})
This is especially effective for UI libraries and packages with deep import trees. Use optimizer.ssr for node/edge environments and optimizer.client for jsdom/happy-dom environments.
Code Coverage
If code coverage generation is slow on your project you can use DEBUG=vitest:coverage environment variable to enable performance logging.
$ DEBUG=vitest:coverage vitest --run --coverage

 RUN  v3.1.1 /x/vitest-example

  vitest:coverage Reading coverage results 2/2
  vitest:coverage Converting 1/2
  vitest:coverage 4 ms /x/src/multiply.ts
  vitest:coverage Converting 2/2
  vitest:coverage 552 ms /x/src/add.ts
  vitest:coverage Uncovered files 1/2
  vitest:coverage File "/x/src/large-file.ts" is taking longer than 3s
  vitest:coverage 3027 ms /x/src/large-file.ts
  vitest:coverage Uncovered files 2/2
  vitest:coverage 4 ms /x/src/untested-file.ts
  vitest:coverage Generate coverage total time 3521 ms
This profiling approach is great for detecting large files that are accidentally picked by coverage providers. For example if your configuration is accidentally including large built minified Javascript files in code coverage, they should appear in logs. In these cases you might want to adjust your coverage.include and coverage.exclude options.
Inspecting Profiling Records
You can inspect the contents of *.cpuprofile and *.heapprofile with various tools. See list below for examples.